For traders who enjoy conducting technical analysis and making predictions related to the prices of traded cryptocurrencies, you can utilize the advanced charting feature available on Indodax to enhance the accuracy of your predictions. This feature is powered by TradingView, and you can utilize the provided toolbar to customize it according to your preferences.
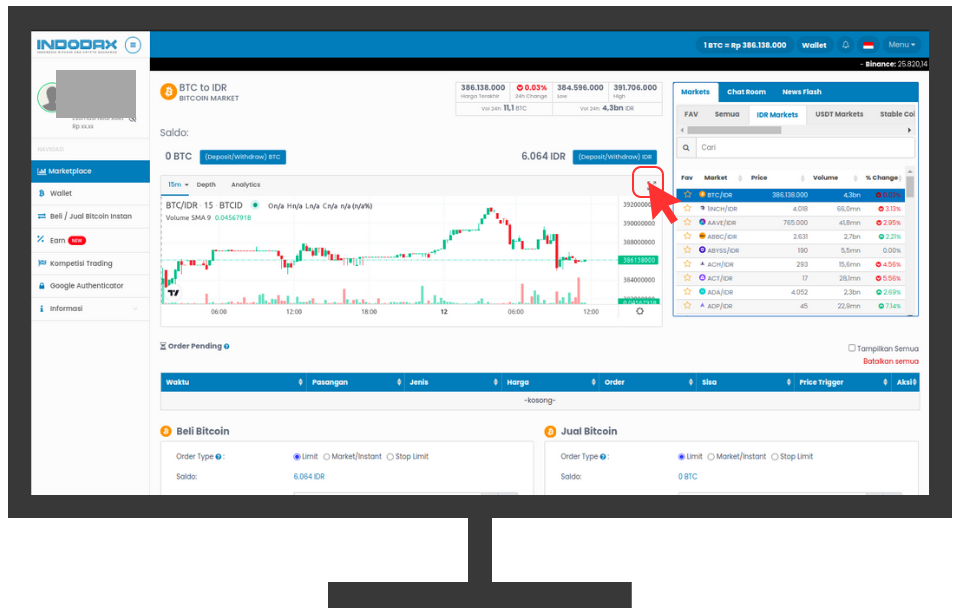
The Advanced Chart on the Indodax website.
To access the advanced chart on the Indodax website, please click on the following Fullscreen icon.
Afterwards, you will encounter the following display of the advanced chart:
To understand the available options in the advanced chart, here is a brief explanation of the options and icons:
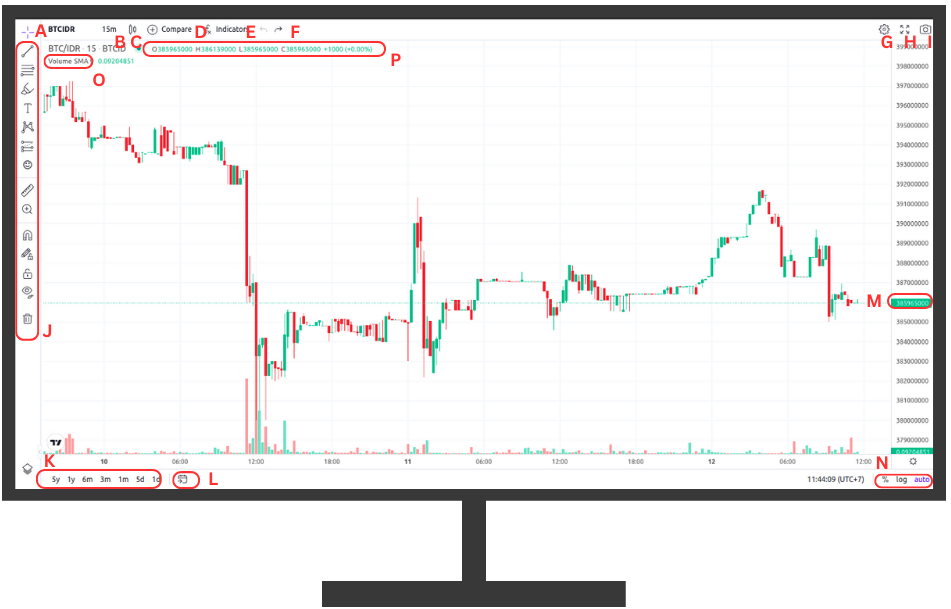
- A - Cursor design options
- B - Candle interval options
- C - Chart display options (Bars, Candles, Hollow Candles, Line, Area, Baseline, Heikin Ashi)
- D - Options to compare with other digital asset markets
- E - Available indicator options
- F - Redo and undo options
- G - Chart settings options
- H - Fullscreen display option
- I - Option to save customized chart images
- J - List of toolbar options for chart customization
- K - Total time frame options in the chart window
- L - Option to view the chart on specific dates and times
- M - Current market price
- N - Options to switch price axis to percentage, logarithmic view, and manual/automatic scaling
- O - Individual indicator property view
- P - Opening (O), High (H), Low (L), and Closing (C) prices for the selected candle
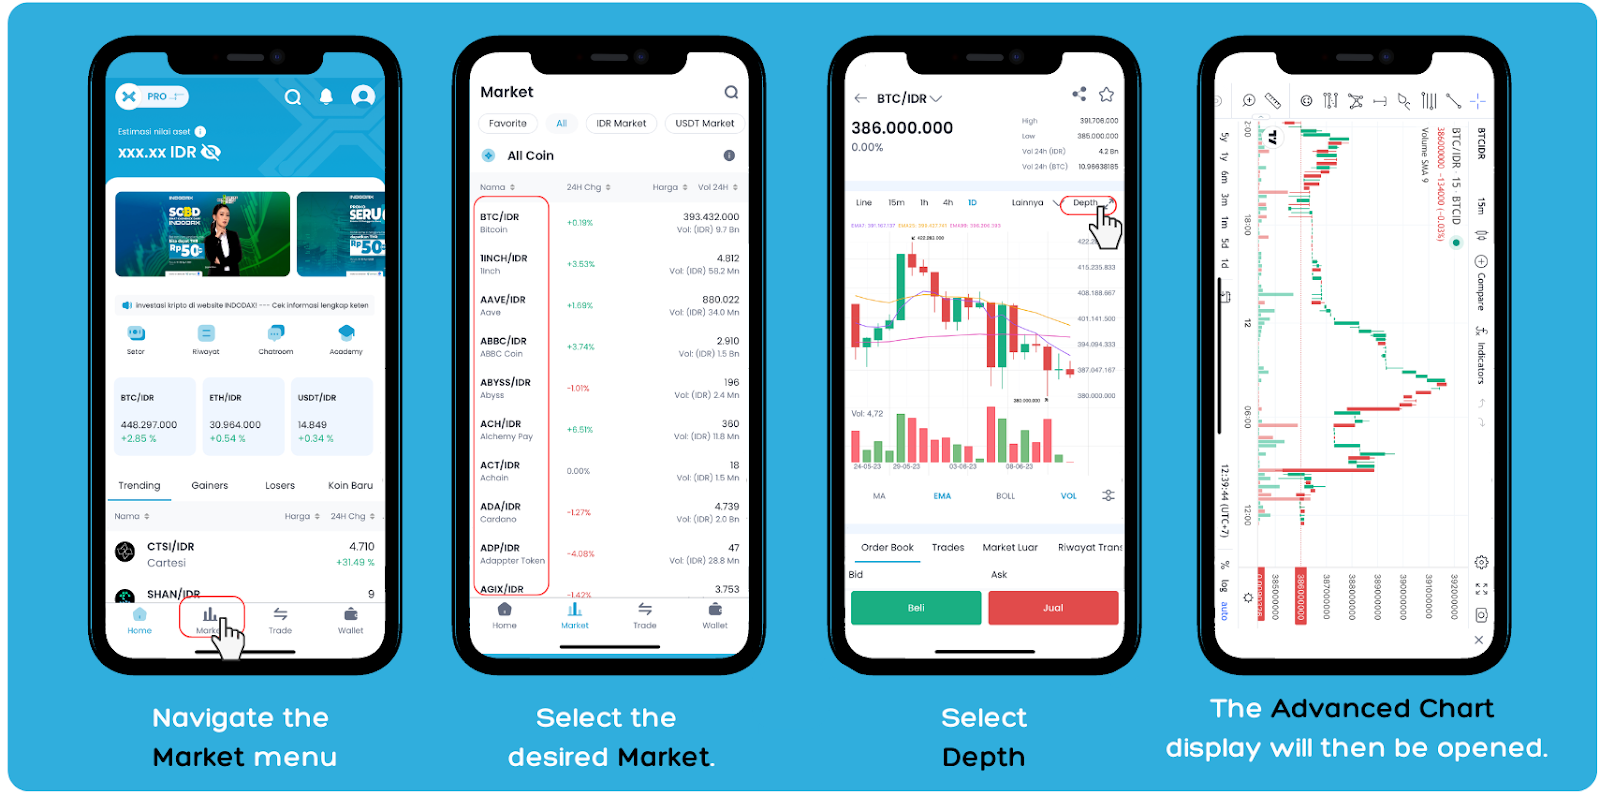
The Advanced Chart feature in the Indodax application:
You can also access the Advanced Chart feature through the Indodax application. To access it, you can follow the steps below:
- Please ensure that you are in PRO mode, then navigate the Market menu.
- Select the desired Market.
- Select Depth.
- The Advanced Chart display will then be opened.